The paper industry is steadily climbing back in most fiber categories after experiencing significant downturns last year. Most forest products grades are on growth patterns, with pricing inching upward. Only kraft paper remains in decline because of its battle with plastic bags; however, manufacturers are still holding on to their prices. The following is a review and outlook for these various grades.
NEWSPRINT
Newsprint was one of the few paper segments that saw higher prices late last year. During the previous upturn from 1989 to 1991, about 2.25 million tons of added capacity came online prior to a 6 percent decline in use, damaging the sector, that suffered through three straight years of difficult prices.
Although nearly 2 million tons of newsprint capacity had been closed down or used for groundwood specialty papers since 1991, the grade fell to $410 a ton in early 1994. By that point, the supply/demand situation had become favorable. With worldwide economics strong during much of the ensuing period, the sector has seen seven price hikes since then. The latest hike, September 1995, raised prices more than 80 percent from their cycle low.
Although inventory adjustments held down demand at the end of 1995, domestic newsprint capacity was expected to increase 0.3 percent a year between 1995-1998.
UNCOATED PAPER
Despite a period of frenzied price hikes that lasted well into October 1995, producers of uncoated paper fell victim to inventory overstocking. The uncoated paper market is mostly freesheet paper, while the remainder is uncoated groundwood paper. Combined, they represent 35 percent of domestic paper shipments in 1994.
Prices for uncoated freesheet paper bottomed out at $680 a ton in the second quarter of 1994, but with a stronger domestic economy and greater export volumes stimulating an almost nonstop round of increases, prices spiked to $1,070 a ton in October 1995. Since then, inventory adjustments and high levels of imports from Brazil contributed to weakening conditions and a drop in prices to about $880 to $920 per ton. In addition, in October 1995, suppliers rescinded the $60 a ton price increase for cut-size paper.
Nevertheless, some believe the uncoated paper market is a prime example of the inventory adjustment theory in action. As such, they expect the grade to have a favorable performance in 1996. That optimism is based on two factors. The first is the expectation that demand for uncoated freesheet will exceed gross domestic product in 1996. The second is the lack of capacity expansion taking place in that grade. Although no major pricing resurgence is foreseen, slight increases would not be surprising.
Uncoated groundwood papers are made in a variety of qualities. It is primarily used for newspaper inserts and direct-mail flyers. With many viewing uncoated groundwood as a favorable lower-priced alternative to coated paper, the segment has experienced exceptional shipment gains during the past two years.
Domestic shipments increased 9.7 percent in 1994, with a further year-to-year increase of 13 percent the first eight months of 1995. Like most grades, coated groundwood also experienced strong pricing since 1994’s second half. Although nominal U.S. capacity is being added, the upward shifting from newsprint and downward shifting from coated papers is unlikely to reach levels of recent years, virtually guaranteeing slower growth trends.
COATED PAPER
During 1994, coated groundwood represented a little more than half of U.S. coated paper capacity. The remaining capacity was freesheet paper. In 1989, coated paper accounted for 20 percent of domestic paper shipments.
North American and European producers initiated aggressive coated paper expansion programs during the late 1980s, resulting in 26 new machines starting up in the five years between 1989 and 1993. These additions boosted worldwide coated paper capacity by 40 percent to 21 million tons.
Unfortunately, they came online as worldwide economies were entering a recession. As a result, the overall capacity utilization rate for coated paper fell below 92 percent in the early 1990s, with freesheet paper in the mid-to-high 80 percent range. Prices fell as the early 1990s progressed.
In 1994, global economic recoveries stimulated enough coated paper demand to absorb the industry’s excess capacity, letting capacity utilization rates reach 94.4 percent for freesheet and 97.0 percent for groundwood. Both freesheet and groundwood reached their pricing troughs in 1994’s second quarter.
However, since then, there has been strong coated paper demand for publications; domestic ad pages increased 5.3 percent in 1994 and continued strong in 1995. In addition, limited capacity expansion let producers implement price increases last fall.
However, with slowing global economies and inventory buildups leading to lower order rates, September 1995 domestic shipments of coated freesheet paper dropped 16 percent, and groundwood shipments fell 7.5 percent. This produced the current cycle’s first discounting in those markets.
Although the industry will have to contend with the 250,000 tons of capacity expansion coming online this year, some believe the expansion will be pushed back to early 1997. Given these trends, coated paper conditions should be favorable in 1996.
SANITARY PAPER
The sanitary paper market, which has 6.6 million tons of domestic annual capacity, is divided into the consumer market and the commercial/industrial market. The consumer market accounts for about 65 percent of domestic production; C&I products the other 35 percent.
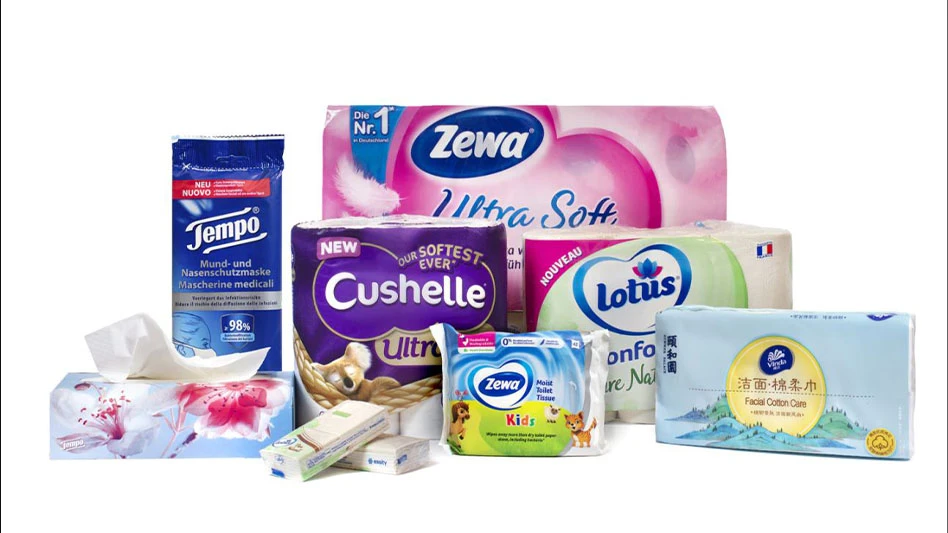
Bathroom tissue, accounting for 42 percent of volume, holds the largest share of the combined tissue markets, followed by paper towels (32 percent), napkins (13 percent), facial tissue (6 percent), and other sanitary products (7 percent).
The top five U.S. producers of tissue products are Kimberly-Clark, Fort Howard Paper, James River, Procter & Gamble, and Georgia Pacific. Together, these five companies hold a domestic market share of 79 percent.
Demand for tissue is related to population growth. Therefore, it tends to be much more stable. Nevertheless, with a variety of other factors coming into play, tissue producers had some difficult trends to ride out during much of the early 1990s. One factor was overcapacity. With an average of 185,00 tons of capacity coming on board each year between 1988 and 1991 – and production increasing by 92,000 tons per year in that period – the tissue market watched domestic capacity utilization fall from the 97 percent posted between 1988 and 1990 to 90 percent between 1991 and 1992.
In addition, even though economic trends do not have a great influence on tissue markets, C&I markets suffered during the early 1990s from a weak domestic economy. Finally, in addition to battling a poor demand/supply equation, the consumer market was also impacted by competitive pressures spawned by K-C’s reentry into consumer bath tissue.
Modest demand growth and limited capacity expansion since 1991 boosted the tissue market’s domestic use rate to 92 percent in 1993 and 1994, with operating rates estimated to reach 94 percent in 1995. In addition, stringent economic conditions allowed for price hikes in the C&I sector since 1995, while rising fiber costs precipitated price increases in consumer markets beginning in late 1994.
With little capacity expansion coming online in recent years – and less planned for the rest of the decade – the operating performance of the tissue market should remain solid in the foreseeable future.
KRAFT PAPER
During the past decade, the use of plastic bags has eroded kraft paper demand. As a result, domestic production has dropped more than 50 percent since 1985, prompting producers to reduce production capacity for kraft paper grades by more than 40 percent.
Partly offsetting the extreme weakness in grocery bag shipments were gains in two other product uses: a 10 percent rise in multiwall bag paper, used in shipping sacks, and a 6 percent rise in bleached kraft paper shipments. Interesting, prices for kraft paper have increased almost every year since 1992, as producers, who do not believe discounts will generate any additional business, refuse to cut prices.
MARKET PULP
Worldwide, the European Union is by far the largest purchaser of market pulp, accounting for 41 percent of market pulp consumption in 1994, followed by the U.S. (18 percent), and Japan (17 percent). Northern bleached softwood kraft is regarded as the bellwether grade of market pulp, and it tends to trade at the highest prices. When market pulp markets are tight, price differences narrow, with the opposite occurring in weak markets.
According to the U.S. Commerce Department, about 62 percent of the world pulp output in 1994 came from NORSCAN (North American and Scandinavian) countries, with exports representing about two-thirds of U.S. shipment volume during the year. This represents a decrease from the 71 percent it held in 1984, and, due to the ongoing pressures from mills in South America and Asia, the NORSCAN share will probably keep tumbling. Not only do those areas have abundant wood resources, they also boast lower costs in labor and environmental protection.
After being crippled by the paper market’s malaise during the early part of the 1990s, market pulp broke out after the benchmark NBSK troughed at about $400 a ton in late 1993. Prices for NBSK have since more than doubled, reaching $985 a ton last October. These increases were driven by strengthening world economies and tight pulp inventories.
With worldwide capacity on the rise and higher prices stimulating expansion and the startup of plants that have been shut down, it appears market pulp has reached its peak. Nevertheless, with the overall paper market to remain solid for the next year or so, conditions should firm from the difficulties experienced since last fall. Those problem included the rollback of the October 1, 1995, NBSK price hikes and subsequent price declines, which brought NBSK to the $725-a-ton level as of February 1, 1996.
CORRUGATED BOX
Strengthening domestic and global economies led to 5 percent average annual growth in domestic corrugated box shipment between 1992 and 1994, and capacity of containerboard rose at half that rate during the period. A four-year string of oversupply conditions in containerboard markets ended in the third quarter of 1993. In addition to demand outstripping capacity growth during that quarter, the sector received a large boost from a total of 400,000 tons of downtime taken in fall 1993, which happened as box demand started to explode.
Domestic containerboard inventories fell to their lowest levels in 13.5 years, reaching 2.13 million tons in October 1994. Those conditions led to linerboard price increases, which surged to about $555 a ton in mid-1995 from about $290 a ton two years earlier.
Unfortunately for linerboard producers, the mid-1995 period was the peak of the current upcycle. Following domestic 6 percent year-to year growth in corrugated box shipments in 1995’s first quarter, a 0.7 percent decline was recorded in the second quarter, followed by a 5.5 percent drop in the third quarter. For the full nine-month period, box shipments were lower, in comparison with a 4 percent increase in linerboard production. The downturn was attributed to a slowdown in global economies that happened when new capacity levels, particularly recycled container board, came online.
Also, inventories at domestic box plant and mills reached an all-time high of 3.25 million tons in July 1995. Though inventories fell during the next three months, they remained at 2.97 million tons at year-end 1995, up 40 percent from the year-earlier cycle low.
Despite the slowdown in container board markets, some recycled board producers were boasting better margins in late 1995. During container board’s boom, prices of recovered fiber used in recycled products rose faster than linerboard prices. Old corrugated container prices rose from about $35 a ton in 1993 to a peak of about $222 a ton in spring 1995. Nevertheless, with OCC prices falling to the $20- to 40-a-ton range in late 1995, they were having more of an impact on margins of certain producers than lower container board prices.
BOXBOARD
Domestic boxboard production is divided into solid bleached sulfate board, unbleached kraft boxboard and recycled boxboard. In the past decade, conditions have changed the boxboard business. SBS has been losing market share to recycled grades. SBS has also been hurt by a continued erosion of its place in the domestic packaging market. By 1994, plastics managed to garner a 75 percent domestic share, leaving SBS – which accounted for as much as 35 percent to 36 percent of domestic boxboard consumption through much of the 1980s – with the remaining 25 percent. Of that share, recycled boxboard account for more than half, with unbleached kraft board representing 18 percent, up from less than 15 percent in 1993.
Although plastic has also taken away market share in boxboard areas other than milk containers, folding cartons have managed to record modest growth during the past decade. The growth was achieved through an expansion of end-use applications. Following poor sales in 1993, demand for boxboard accelerated in 1994 on the back of a strong export market. Mills found it difficult to meet new orders during that period, resulting in price increases being put through.
More forecasts are calling for demand to return to its slow growth pattern during the next few years. Although extra demand will not absorb all the new capacity, strong exports for boxboard will offset much of the difference.
The author is with Standard & Poor’s. The article was excerpted from S&P’s Industry Survey, and printed with permission.
Latest from Recycling Today
- U.S. Aluminum Co. explores aluminum fabrication plant in Oklahoma
- Sonoco completes portfolio transformation
- Eriez Shred1 data demonstrates scalable copper control
- RCI selects CurbWaste as exclusive operational management platform
- Updated: Supreme Court strikes down IEEPA tariffs
- Recycling Today Media Group launches Scrap Expo Lunch & Learn Webinar Series
- LyondellBasell scales back recycling target
- Former Liberty UK mills eyed by 3 suitors